

Free Data Analysis and Plotting Software — What Really Replaces Origin, and What Does Not
Test results, sensor readings from monitoring, lab data — in most offices and labs they end up in Excel, Origin or MATLAB, and then in a report chart. Origin and MATLAB need a paid licence, and Excel charts quickly hit their limit once you need serious curve fitting, an FFT or the same processing on hundreds of files.
The real question for an engineer is not which program draws a pretty chart, but which tool takes a raw file to a figure in a report in a way that can be repeated and checked. Here are ten free tools, grouped by the kind of work, with an honest note on where each one stops.
Point-and-click plotting — the closest to Origin
1. LabPlot
An Origin-style interface: you import CSV, Excel files, databases or data from measuring instruments and build publication-quality 2D and 3D plots. It includes curve fitting, filtering, FFT, statistics and computational notebooks. Actively developed by KDE under the GPL, with no limit on commercial use.
What is missing: anyone arriving with years of Origin templates and projects will have to rebuild them, and the range of ready-made analyses is smaller.

LabPlot
KDE
Data analysis and scientific plotting in a graphical interface — a free alternative to Origin, with curve fitting and FFT.
Get it from the vendor2. SciDAVis
Data sheets, publication-quality plots, linear and non-linear curve fitting, basic statistics, Fourier transforms and filtering. Repetitive work can be turned into a Python script. A good fit for lab reports, theses and processing experimental results.
What is missing: the statistics are basic only, and the interface is simpler and older-looking than LabPlot’s.
SciDAVis
SciDAVis (open-source project)
Scientific data analysis and publication-quality plotting — tables, curve fitting and Python scripting.
Get it from the vendor3. LibreOffice Calc
The LibreOffice spreadsheet opens and saves Excel files, includes a Solver, pivot tables and macros, and is fine for quick charts and short calculation sheets.
What is missing: the same limits as Excel charts — no convenient advanced curve fitting or FFT, and repeating one processing chain across dozens of files is awkward.

LibreOffice
The Document Foundation
A full office suite — documents, spreadsheets, presentations and drawings, compatible with Office files.
Get it from the vendorNotebooks and code — when the processing has to repeat
4. Python
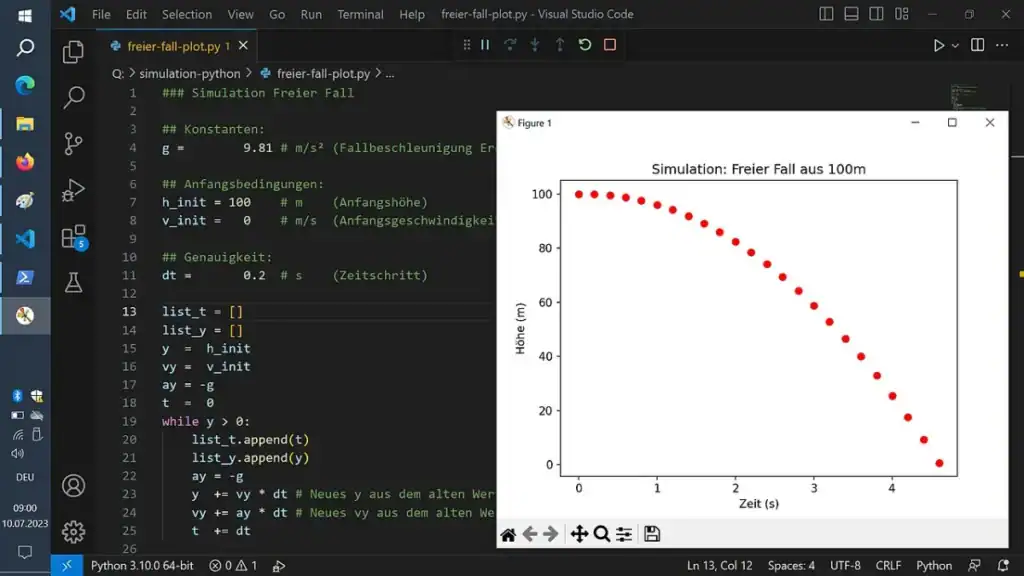
With NumPy, SciPy, pandas and Matplotlib this is the broadest free replacement for MATLAB plotting and analysis: reading files, filtering, fitting, statistics and figures — and one script that runs over every test.
What is missing: you have to write code, and there is no single ready-made interface. It pays off when the work repeats.

Python
Python Software Foundation
The language behind most modern engineering computation, and its full ecosystem.
Get it from the vendor5. JupyterLab
A notebook where code, results, plots and explanation sit in the same document — a transparent calculation sheet that can be checked and re-run. It works with Python, R, Julia and other languages, locally in the browser.
What is missing: it is a working environment, not an analysis tool; the capabilities come from the libraries you install.

JupyterLab
Project Jupyter
Interactive computing notebooks — code, results, plots and explanations in one shareable document.
Get it from the vendor6. R
A language for statistics and graphics with tens of thousands of packages. In engineering it is used for statistical quality control, design and analysis of experiments, reliability and fatigue, and long measurement series.
What is missing: a steep learning curve for non-statisticians, and it is a less natural fit for signal processing.

R
R Foundation
The leading language for statistics and data analysis — quality control, experiment analysis, reliability and forecasting.
Get it from the vendor7. gnuplot
A few lines of script turn a data file into a 2D or 3D plot, with export to PDF, SVG, PNG and LaTeX-friendly formats. Ideal for figures regenerated from a test rig or solver output.
What is missing: it is a plotting tool, not an analysis tool, with no data sheet and no point-and-click interface.

gnuplot
gnuplot Project
Publication-quality plotting driven from scripts.
Get it from the vendorData cleaning and workflows
8. OpenRefine
Tidies messy tables before the analysis: it merges values written in different forms, removes duplicates, splits and joins columns and converts formats. Every step is recorded, undoable and repeatable.
What is missing: no plots and no numerical analysis; it is the preparation step only.

OpenRefine
OpenRefine
Clean up messy data tables — duplicates, inconsistent names, splitting columns and conversions.
Get it from the vendor9. KNIME Analytics Platform
You build a workflow from graphical nodes instead of writing code: reading files and databases, cleaning, merging, statistics and reports. It suits process and quality engineers who process production or measurement data repeatedly. The desktop edition is free without limits; KNIME sells paid server products.
What is missing: it is fairly heavy, and its charts are less suited to a finished report figure.

KNIME Analytics Platform
KNIME
Data processing and analysis with visual workflows, no coding — cleaning, merging, statistics and machine learning.
Get it from the vendorImage-based measurement
10. Fiji (ImageJ)
When the data is a photograph: you calibrate the scale and measure lengths, areas and angles, count particles and analyse grain size and porosity. Materials and soil labs use it to measure cracks and microstructure.
What is missing: it produces numbers, not report charts — the results go on to one of the tools above.

Fiji (ImageJ)
ImageJ / Fiji community
Scientific image processing and analysis — measure cracks, grains, pores and dimensions from photos and micrographs.
Get it from the vendorSo can you drop Origin?
For most reports and theses — yes. Students and anyone who wants a point-and-click interface should start with LabPlot or SciDAVis. Anyone processing many identical files or monitoring data will gain from Python in JupyterLab, and R suits heavy statistical analysis. Quality engineers who avoid code will like KNIME. If you depend on existing Origin templates and projects, or on its specialised ready-made analyses, test the move before dropping the licence.
More tools in the numerical and productivity categories.