

ParaView — The Complete Guide: Free Visualisation of Simulation Results and Scientific Data
ParaView was developed by Kitware together with US national laboratories (Sandia and Los Alamos), and it is the world's standard tool for visualising simulation results: CFD, finite elements, measurement data and geophysical models. It is built on the VTK library, runs on Windows, macOS and Linux, and can handle models of billions of cells on supercomputers.

ParaView
Kitware / Sandia / Los Alamos
Large-scale simulation post-processing — slices, streamlines and animation.
Get it from the vendorWhat you do in ParaView
- Slices and clips — Slice and Clip to see what happens inside the model.
- Streamlines — Stream Tracer to visualise flow.
- Isosurfaces and contours — Contour for a pressure, temperature or stress field.
- Plots — Plot Over Line for a profile along a line, and plots over time.
- Animations — time-dependent results, exported to video and high-quality images.
Filters — the central idea
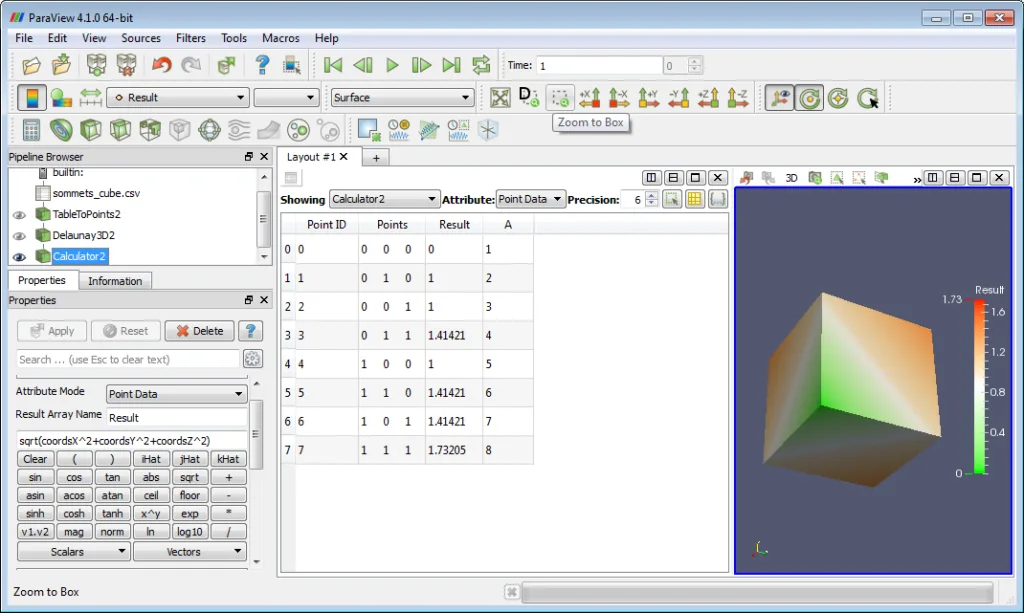
Every operation in ParaView is a filter applied to the data, and filters connect into a pipeline. For example: read results → slice → colour by velocity → streamlines from the slice. You can save the pipeline as a state and apply it to another run, or record it as a Python script and run it automatically.
Formats
ParaView reads OpenFOAM results directly, as well as VTK, Exodus, CGNS, EnSight, STL, CSV and many more. Code_Aster and SALOME use it as their viewer (ParaVis), and SU2 and Elmer FEM export to it.

OpenFOAM
OpenFOAM Foundation
Comprehensive CFD solvers — flow, turbulence, heat transfer and multiphase. Text-file driven, no GUI.
Get it from the vendor
Code_Aster
EDF
EDF industrial finite element solver — nonlinear, dynamic and thermo-mechanical, open source.
Get it from the vendor
SALOME
CEA / EDF / OPEN CASCADE
Geometry, meshing and post-processing platform for FEA, around external solvers.
Get it from the vendor
SU2
SU2 Foundation
Multiphysics CFD with adjoint-based design optimisation — systematic shape improvement.
Get it from the vendor
Elmer FEM
CSC — IT Center for Science, Finland
Multiphysics FEA — solids, flow, heat and electromagnetics — with its own graphical interface.
Get it from the vendorWhat's missing
The interface is busy, and beginners take time to understand the logic of filters. ParaView does not run simulations or build geometry — it only displays and analyses results. For a quick look at a single file, a simpler tool is sometimes enough.
Who it suits
Anyone running CFD or FEA with open tools, researchers working with 3D data, and anyone who needs professional images and animations for reports and presentations.
Alternatives and companion tools
VisIt is another open alternative, particularly strong with large data. And for quick 2D plots — gnuplot.
VisIt — Simulation Results Visualization
Lawrence Livermore National Laboratory
Scientific visualization tool for large datasets from FEA and CFD simulations.
Get it from the vendor
gnuplot
gnuplot Project
Publication-quality plotting driven from scripts.
Get it from the vendorBottom line
If you work with open-source simulations, ParaView is where you will see the results. It is worth a few hours to learn the filters.